How can anyone say we are experiencing "global warming" when it can not, and is not being accurately measured? (See the following article.) This seems rather fundamental to the question of man-caused global warming. Do we merely watch glaciers melting in the summer, (which they of course always do) and say...."oh my, yes, it is warming")? There has been so much distortion of the reality of normal climate change that many people accept "global warming" as a fact, when it certainly may not be. Catastrophic climate change as a result of global warming? This is a total fallacy and fabrication; the ultimate scandal and swindle of our time. Thank you very much, Mr. "Peace Prize" Al Gore.
Peter
CONTAMINATED DATA: HOT CITIES, NOT CO2, CAUSE URBAN THERMOMETERS TO RISE
Below is the famous graph of "global average surface temperature," or "global temperature" for short. The data come from thermometers around the world, but between the thermometer readings and the final, famous, warming ramp, a lot of statistical modelling aims at removing known sources of exaggeration in the warming trend.
In a new article just published in the Journal of Geophysical Research - Atmospheres, a co-author and I have concluded that the manipulations for the steep post-1980 period are inadequate, and the above graph is an exaggeration. Along the way, I have also found that the United Nations agency promoting the global temperature graph has made false claims about the quality of its data.The graph at right comes from data collected in weather stations around the world. Other graphs come from weather satellites and from networks of weather balloons that monitor layers of the atmosphere. These other graphs don't show as much warming as the weatherstation data, even though they measure at heights where there is supposed to be even more greenhouse-gas-induced warming than at the surface. The discrepancy is especially clear in the tropics.
The surface-measured data has many well-known problems. Over the post-war era, equipment has changed, station sites have been moved, and the time of day at which the data is collected has changed.Many long-term weather records come from in or near cities, which have gotten warmer as they grow. Many poor countries have sparse weather-station records and few resources to ensure data quality. Fewer than one-third of the weather stations operating in the 1970s remain in operation.Scientists readily acknowledged that temperature measurements are contaminated for the purpose of measuring climate change. But they argue that adjustments fix the problem.
To deal with a false warming generated by urbanization, they have the "Urbanization Adjustment." To deal with biases due to changing the time of day when temperatures are observed, they have the "Time of Observation Bias Adjustment." And so forth.How do we know these adjustments are correct? In most studies, the question is simply not asked. A few studies argue that the adjustments must be adequate since adjacent rural and urban samples give similar results. But closer inspection shows some of these papers don't actually give similar results at all, or when they do they define "rural" so broadly that it includes partly urbanized places.
Other studies say the adjustments must be adequate because trends on windy nights look the same as trends on calm nights. But the long list of data problems includes issues just as serious under both windy and calm conditions.The papers describing the adjustments aim to construct data showing what the temperature would be in a region if nobody had ever lived there. If the adjustments are right, the final output should not be correlated with the extent of industrial development and variations in socioeconomic conditions. But in a 2004 study with climatologist Patrick Michaels, we found that the adjustment models were not removing the contamination patterns as claimed. If the contamination were removed, we estimated the average measured warming rate over land would decline by about half.
Dutch meteorologists using different data and a different testing methodology had come to the same conclusions.In response to criticisms of our paper, I began assembling a more complete database, covering all available land areas and a more extensive set of climatological and economic indicators. Meantime, in 2005, I was asked to serve as an external reviewer for the IPCC report, which was released earlier this year. I accepted, in part to address the data-contamination problem.
Scientists who attribute warming to greenhouse gases argue that their climate models cannot reproduce the surface trends from natural variability alone. They then attribute it to greenhouse gases, since (they assume) all other human influences have been removed from the data by the adjustment models. If that has not happened, however, they cannot claim to be able to identify the role of greenhouse gases. Despite the vast number of studies involved, and the large number of contributors to the IPCC reports, the core message of the IPCC hinges on the assumption that their main surface climate data set is uncontaminated. And by the time they began writing the recent Fourth Assessment Report, they had before them a set of papers proving the data are contaminated.How did they handle this issue?
In the first draft of the IPCC report, they simply claimed that, while city data are distorted by urban warming, this does not affect the global averages. They cited two familiar studies to support their position and ignored the new counter-evidence. I submitted lengthy comments criticizing this section. In the second draft there was still no discussion, so again I put in lengthy comments. This time the IPCC authors wrote a response. They conceded the evidence of contamination, but in a stunning admission, said: "The locations of socioeconomic development happen to have coincided with maximum warming, not for the reason given by McKitrick and Mihaels [sic] (2004), but because of the strengthening of the Arctic Oscillation and the greater sensitivity of land than ocean to greenhouse forcing, owing to the smaller thermal capacity of land."
Note the irony: Confronted with published evidence of an anthropogenic (but non-greenhouse) explanation for warming, they dismissed it with an unproven conjecture of natural causes. Who's the "denialist" now? Furthermore, the claim is preposterous. The comparison of land and ocean is irrelevant since we were only talking about land areas. The Arctic Oscillation is a wind-circulation pattern that affects long-term weather trends in the Arctic. It certainly plays a role in explaining Arctic warming over the past few decades. But for IPCC lead authors to invoke it to explain a worldwide correlation between industrialization and warming patterns is nonsense.
FULL STORY here
Showing posts with label global temperature. Show all posts
Showing posts with label global temperature. Show all posts
Sunday, December 9, 2007


Friday, November 30, 2007
Atmospheric Temperature and Rising CO2 Levels Do Not Correlate In Last Decade
The following short article illustrates the disconnect between atmospheric temperature and CO2 levels. I think everyone agrees that surface temperature measurements are of dubious validity for a variety of reasons. These include but are not limited to 1) calibration of instruments, 2) location of measuring stations, and 3) the urban heat island effect.
The following average atmospheric temperatures are derived from satellite measurements, thus they have a much greater sampling area, with calibrated instruments, are not subject to local variations, and thus these satellite temperature measurements are considered the most accurate measure of global atmospheric temperatures.
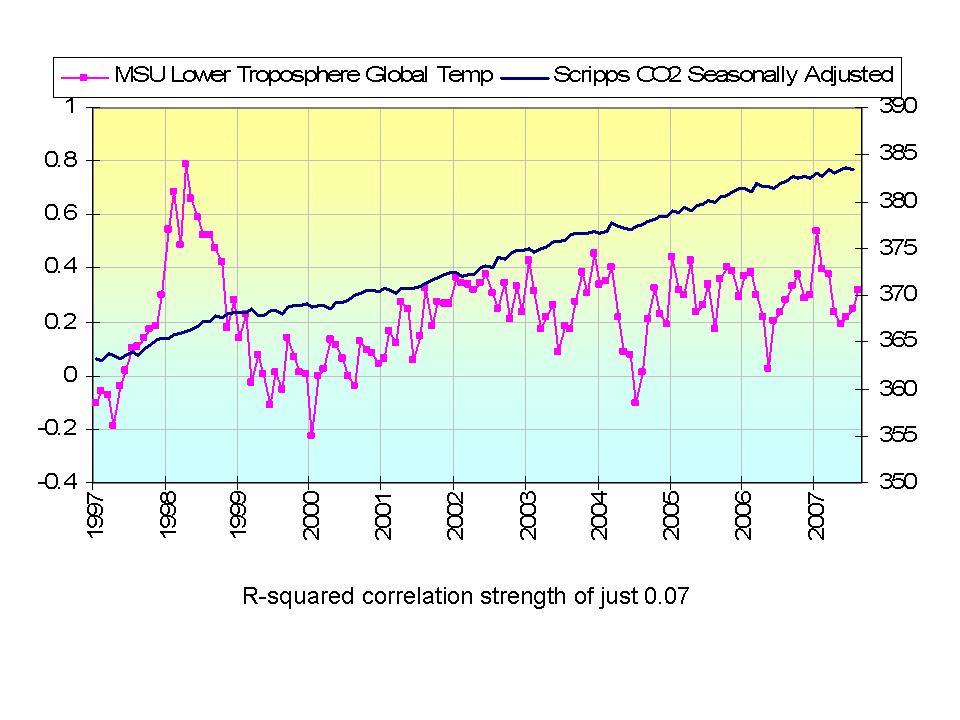
The article goes into more detail, but the key point here, that is so clearly shown in the second graph, is that in spite of steadily increasing carbon dioxide levels, the atmospheric temperature is not rising. This simple observation is completely counter to computer models and predictions of global warming as a result of burning fossil fuels and adding the resultant carbon dioxide to the atmosphere.
If there is no significant recent atmospheric warming, then carbon dioxide emissions must not be a problem. Can anyone question this data, and its interpretation?
And by the way, the source of this article is from an excellent web site titled ICECAP and is located here: http://icecap.us/index.php
They have an impressive list of science advisors and contributors. I highly recommend you examine what they offer.
Peter

The following average atmospheric temperatures are derived from satellite measurements, thus they have a much greater sampling area, with calibrated instruments, are not subject to local variations, and thus these satellite temperature measurements are considered the most accurate measure of global atmospheric temperatures.
The article goes into more detail, but the key point here, that is so clearly shown in the second graph, is that in spite of steadily increasing carbon dioxide levels, the atmospheric temperature is not rising. This simple observation is completely counter to computer models and predictions of global warming as a result of burning fossil fuels and adding the resultant carbon dioxide to the atmosphere.
If there is no significant recent atmospheric warming, then carbon dioxide emissions must not be a problem. Can anyone question this data, and its interpretation?
And by the way, the source of this article is from an excellent web site titled ICECAP and is located here: http://icecap.us/index.php
They have an impressive list of science advisors and contributors. I highly recommend you examine what they offer.
Peter
Tuesday, November 27, 2007
Global Temperatures are Uncorrelated with Carbon Dioxide Trends This Last Decade
By Joseph D’Aleo, CCM
Temperature peaked in 1998 and have shown no warming for a decade now. Many scientists have been remarking about this trend for several years but no one takes heed, preferring to believe models than actual data. Here is the satellite derived global temperature trend since 1979. Note the cooling globally near the volcanically active periods of the early 1980s and 1990s. Note also the warm spike associated with the super El Nino that seemingly marked the beginning of the end of the warm Pacific trend that began in 1978.
By Joseph D’Aleo, CCM
Temperature peaked in 1998 and have shown no warming for a decade now. Many scientists have been remarking about this trend for several years but no one takes heed, preferring to believe models than actual data. Here is the satellite derived global temperature trend since 1979. Note the cooling globally near the volcanically active periods of the early 1980s and 1990s. Note also the warm spike associated with the super El Nino that seemingly marked the beginning of the end of the warm Pacific trend that began in 1978.
Note the subsequent cooling as a series of 3 La Ninas in 4 years helped cool the earth in the late 1990s. Temperatures rebounded a bit in the early 2000s with a slight rebound in the Pacific warmth, three El Ninos and a volcanic aerosol-free stratosphere, but the trend since 2001 has been flat and at a level considerably below the peak of 1998. This lack of warming has occurred despite the increases in carbon dioxide.  Indeed, when comparing this satellite derived temperature trend the last decade with the carbon dioxide increases as seasonally adjusted from Scripps, we find NO CORRELATION (just 0.07 r squared!!!)
See larger image here.
Global warming is over. Man was never responsible.
Indeed, when comparing this satellite derived temperature trend the last decade with the carbon dioxide increases as seasonally adjusted from Scripps, we find NO CORRELATION (just 0.07 r squared!!!)See larger image here.
Global warming is over. Man was never responsible.
See full blog here.
Sunday, October 7, 2007
Geologists Views On Climat Change
An interesting comment about geologists.
Peter
May 22nd, 2005
Climate: Geological Views #1
By Steve McIntyre

I gave a speech last week at my tennis/squash club on climate change (which presents speeches from time to time). I included some geological concepts that I don’t usually have an opportunity to talk about. The class of scientist who tend to be most unimpressed with IPCC-type climate science are geologists - which is where I got started in this. If you took an Oreskes-type survey among geologists, I don’t believe for a minute that you would get anything like IPCC solidarity. Unlike most scientists, geologists also happen to know a lot about climate history. Here’s an interesting graphic that I used: Read the rest of this entry »
Peter
May 22nd, 2005
Climate: Geological Views #1
By Steve McIntyre
I gave a speech last week at my tennis/squash club on climate change (which presents speeches from time to time). I included some geological concepts that I don’t usually have an opportunity to talk about. The class of scientist who tend to be most unimpressed with IPCC-type climate science are geologists - which is where I got started in this. If you took an Oreskes-type survey among geologists, I don’t believe for a minute that you would get anything like IPCC solidarity. Unlike most scientists, geologists also happen to know a lot about climate history. Here’s an interesting graphic that I used: Read the rest of this entry »
Subscribe to:
Posts (Atom)